If we have ever had a conversation, or if you have read any of my material in the past, you know by now that I refer quite a bit to the standard of retirement income planning to compare annuity strategies. That standard in traditional retirement planning is known as, “The 4% Rule.”
First, “The 4% Rule” was never meant to be the “rule.” It was first written about in 1992 by William Bengen who ran thousands of scenarios to determine how much someone could take out of their portfolio and still have a relatively high chance of not running out of money. This research is called, “The Monte Carlo Simulation”, and it has been the standard for retirement planning for the past 30 years.
However, we live in a very different world than we did in 1992. Computer-generated trading that started in the late 90s was just one component that wreaked havoc in our markets. Extreme volatility and low-interest rate environments have dramatically reduced the amount one can safely withdraw from their portfolios to have a relatively high chance of not running out of money over a 30-year period.
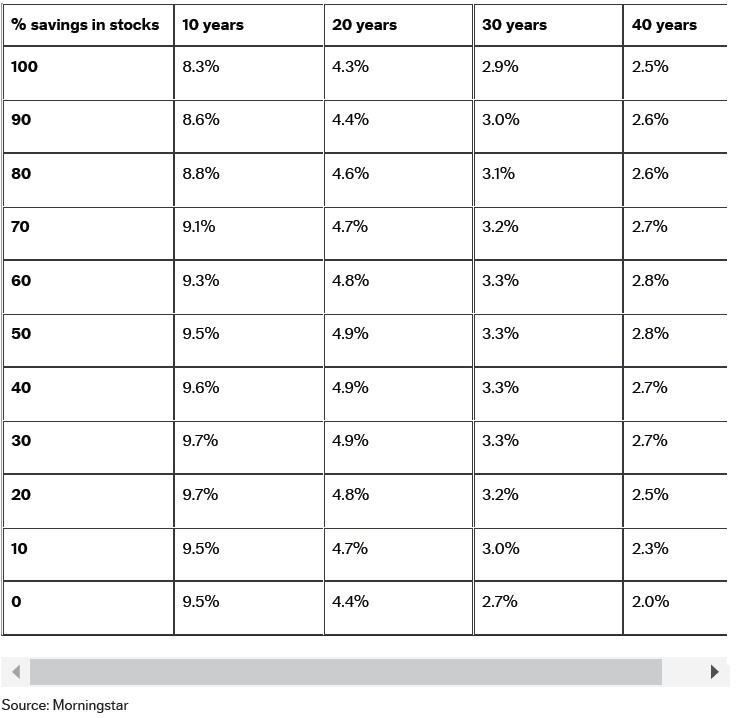
Since I like to use 3rd party sources to back up these types of claims, in this week’s newsletter I will provide you with a chart from Morningstar, one of the leading research firms. I think this chart will not only confirm what I have been saying for several years now but will also shock you when you start to run the numbers in your head of what you can actually spend out of your own portfolio.

I mean, that’s pretty eye-opening. Especially when there are people that have been told that their portfolio will return anywhere from 5%-8% every single year and believe they will be able to live off the interest that is generated to maintain their principal amount.
That is NOT how it works. The above withdrawal rates are not intended to help you maintain your principal amount. They are intended to help you ride the ups and downs of the economy to ensure your money last 30 years. NOT maintain the balance for 30 years.
Please remember, this is not Marty Becker coming up with these numbers. This type of research is conducted by some of the smartest people on the planet. I just know how to implement it strategically to help my client get WAY MORE income with annuities than they could ever safely receive from their managed portfolio.
Example: A 65-year-old couple could get a 6.6% payout rate for a Fixed Indexed Annuity that provides a guaranteed income rider. And let’s say they have $1,000,000 in their portfolio. With traditional retirement planning that is charging a 1% management fee, they could safely withdraw $29,000 per year for income. And again, that doesn’t guarantee that they won’t run out of money. It just increases the chances that they won’t run out of money.
But what if they took half of their portfolio and transferred it to the annuity with a 6.6% payout rate? That would give them $33,000 per year of guaranteed lifetime income and leave them with $500,000 that could be put in low-cost index funds for growth, and/or additional income!
What if they had contacted me when they were 60 years old with the goal of retiring at 65? That same $500,000 would have provided them with $46,845 per year of guaranteed lifetime income!
This is the true power of annuities, and I cannot for the life of me figure out why more people do not take advantage of this process. I will say that the word is spreading because annuity sales are at an all-time historical high. But what is stopping you???
It could just be a misunderstanding of what annuities are and how they work. One of the best ways to learn about annuities is to watch my educational series, “20% More Spendable Income in Retirement.” Then click the “Schedule a Call” button to have a one-on-one call with me so we can design your personalized ATLAS Annuity Strategy!
Happy Father’s Day to all you dads out there! I hope you have a relaxing weekend!
All the best,
Marty
