Have you ever opened your statement or your online investment portal and seen an “average return” listed? Most of the time these “average returns” look amazing! But there’s a part of you that knows something isn’t quite right.
You may wonder to yourself, “If I just earned an average of 20%, why is my account not 20% higher than it was the last time I got one of these statements?”
This is what I refer to as “Wall Street Math.”
Those of you who have watched my videos know what I am getting at. There is a big difference between “average returns” & “actual returns.” A big difference!
I had a nice conversation with a gentleman this week who was being pushed into surrendering his current annuity, to the tune of a $68,000 surrender charge, to only then risk his money in the market with a promise of an “average 8% return.” Sounds pretty good…on the surface.
My first question to him was, “Do you know the difference between an average return versus an actual return?”
He said he remembers seeing something in one of my videos about it but would like to revisit it.
An average return is when you take all the returns of a certain period of time, add them up, including losses, and then divide them over the period of years that you are looking at.
An actual return is when you take the actual dollar amount you started with and then compare it to how much you have in the future. That is how you know what your real return is.
And those two types of returns tell a very different story. Here’s an example:
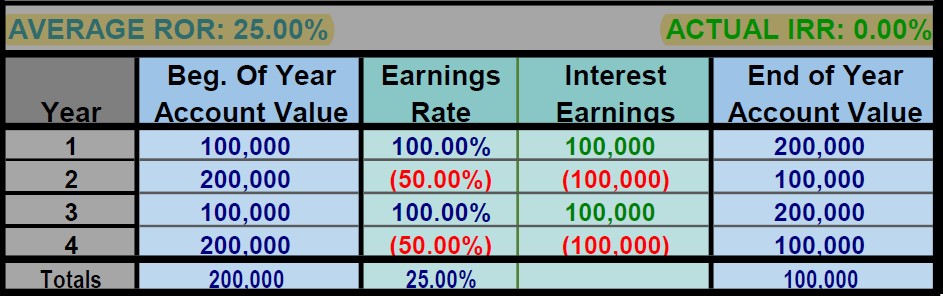
You see, if I double your money the first year, then lose half, then double it again, then lose half, you end up with an average return of 25%! And you feel so good when you see that in your statement.
But your actual return was 0%! Nothing. You started with $100,000, and 4 years later you still have $100,000. Plus, I didn’t factor in inflation and fees. If I did that you would have less than $100,000 with a negative actual return, but your average return would still be…25%.
This is the major problem when it comes to income planning. Average returns don’t mean jack because they do not take the losses into consideration when income planning.
This led me to our next topic: Purpose of Money
“What is the purpose of the money?”, I asked. “Is it to provide income, or are you trying to grow it?”
“I need income, but I would like it to grow.”
This is where I have to hold the line because the more purposes you assign to a dollar, the less effective that dollar becomes. He admitted that income was the most important at this juncture in his life.
His current annuity was set to pay him just under $54,000 per year! Guaranteed for life. No questions asked. No managing to do. Just turn it on and it shows up…forever.
That led to our next topic: Sequence of Returns Risk
The income he was set to receive was a 7.12% payout rate from the initial amount he funded the annuity with, and it was guaranteed for life. The recommended amount you should take out of a managed portfolio is no more than 4%. After he would have paid the surrender charge, at the recommendation of the person trying to convince him to move it, his safe withdrawal rate would have given him a little over $27,000 per year, with no guarantee that the money would last the rest of his life.
This gentleman was trying to be convinced to take 50% less income, with no guarantees, for the promise of an 8% average return. Unbelievable.
And here’s the thing – maybe they could get him an 8% return, but they cannot do that without all of his money in equities (i.e., the stock market). But when you put all of your money in the stock market, you put yourself at risk of the Sequence of Returns, which is the whole reason advisors recommend bonds and other fixed-income investments.
So, if this gentleman does move his money back into the market it could go really well, or it could go really bad.
Let’s take a look at two different scenarios:
The following chart shows what would happen if he had the returns of the S&P 500 starting in 1995 – Present. This is what’s known as a Positive Sequence of Returns:
Now, if this happens, then he would have made the right choice. And this is the scenario these advisors always like to talk about. But it’s a total chance. That’s it.
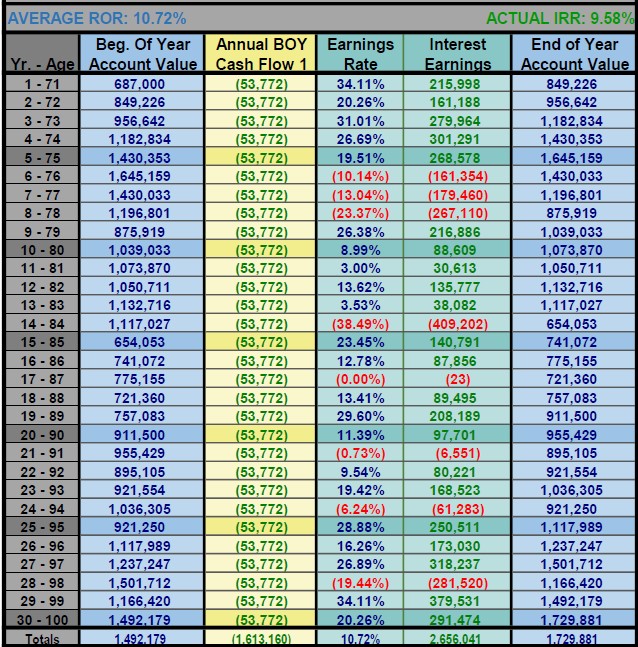
What would happen if it all goes South, and we enter a Negative Sequence of Returns? Here is a scenario looking at the returns of the S&P 500 starting in 2000 – Present.

Whoa! That’s a problem!
What I explained to him was if this scenario happens, the only thing he will get from this other advisor is an apology letter…maybe. I know that because I have a copy of such a letter sent to another client of mine that was with this very same firm during the downturn of 2008.
There will literally be no justice for him to pursue.
If the purpose of the money is to provide income, then this scenario is no different than the guy walking into the casino with his mortgage payment and putting it all on black.
This is the difference between guaranteed income and “IFcome.”
I’m almost done because this is how I wrapped up the conversation. I reminded him I have no skin in this game because I’m not the one who helped him fund the annuity, and I cannot advise him to buy or sell any type of equity product. But, I did tell him to ask one very important question to the person advising him to give up his annuity with the guaranteed income:
“If I surrender my annuity, are you going to guarantee me the same $54,000 per year for the rest of my life, and will you put it in writing?”
I already know the answer…
All the best,
Marty